Tag Archives: kalm services

FortiAuthenticator 4.0 Setup

Setup

For information about installing the FortiAuthenticator unit and accessing the CLI or GUI, refer to the Quick Start Guide provided with your unit.

This chapter provides basic setup information for getting started with your FortiAuthenticator device. For more detailed information about specific system options, see System on page 23.

The following topics are included in this section:

  • Initial setup l Adding a FortiAuthenticator unit to your network l Maintenance l CLI commands
  • Troubleshooting

Initial setup

The following section provides information about setting up the Virtual Machine (VM) version of the product.

FortiAuthenticator VM setup

Before using FortiAuthenticator-VM, you need to install the VMware application to host the FortiAuthenticator-VM device. The installation instructions for FortiAuthenticator-VM assume you are familiar with VMware products and terminology.

System requirements

For information on the FortiAuthenticator-VM system requirements, please see the product datasheet available at http://www.fortinet.com/products/fortiauthenticator.

FortiAuthenticator-VM has kernel support for more than 4GB of RAM in VM images. However, this support also depends on the VM player version. For more information, see: http://kb.vmware.com/selfservice/microsites/search.do?language=en_

US&cmd=displayKC&externalId=1014006

The default Hardware Version is 4 to support the widest base of VM players. However you can modify the VM Hardware Version by editing the following line in the FortiAuthenticator-VM.vmx file:

virtualHW.version = “4”

FortiAuthenticator-VM image installation and initial setup

The following procedure describes setup on VMware Fusion.


Initial setup

To set up the FortiAuthenticator VM image:

  1. Download the VM image ZIP file to the local computer where VMware is installed.
  2. Extract the files from the zip file into a folder.
  3. In your VMware software, go to File > Open.
  4. Navigate to the expanded VM image folder, select the FortiAuthenticator-VM.vmx file, and select Open. VMware will install and start FortiAuthenticator-VM. This process can take a minute or two to complete.
  5. At the FortiAuthenticator login prompt, enter admin and press Enter.
  6. At the password prompt, press Enter. By default, there is no password.
  7. At the CLI prompt enter the following commands:

set port1-ip 192.168.1.99/24 set default-gw 192.168.1.2

Substitute your own desired FortiAuthenticator IP address and default gateway.

You can now connect to the GUI at the IP address you set for port 1.

Suspending the FortiAuthenticator-VM can have unintended consequences. Fortinet recommends that you do not use the suspend feature of VMware. Instead, shut down the virtual FortiAuthenticator system using the GUI or CLI, and then shut down the virtual machine using the VMware console.

Administrative access

Administrative access is enabled by default on port 1. Using the GUI, you can enable administrative access on other ports if necessary.

To add administrative access to an interface:

  1. Go to System > Network > Interfaces and select the interface you need to add administrative access to. See Interfaces on page 30.
  2. In Admin access, select the types of access to allow.
  3. Select OK.
GUI access

To use the GUI, point your browser to the IP address of port 1 (192.168.1.99 by default). For example, enter the following in the URL box:

https://192.168.1.99

Enter admin as the UserName and leave the Password field blank.

HTTP access is not enabled by default. To enable access, use the set ha-mgmtaccess command in the CLI (see CLI commands on page 19), or enable HTTP access on the interface in the GUI (see Interfaces on page 30).

For security reasons, the host or domain names that the GUI responds to are restricted. The list of trusted hosts is automatically generated from the following:

Adding a FortiAuthenticator unit to your network

l Configured hostname l Configured DNS domain name l Network interface IP addresses that have HTTP or HTTPS enabled l HA management IP addresses

Additional IP addresses and host or domain names that the GUI responded to can be defined in the GUI Access settings. See GUI access on page 34

Telnet

CLI access is available using telnet to the port1 interface IP address (192.168.1.99 by default). Use the telnet -K option so that telnet does not attempt to log on using your user ID. For example:

$ telnet -K 192.168.1.99

At the FortiAuthenticator login prompt, enter admin. When prompted for password press Enter. By default there is no password. When you are finished, use the exit command to end the telnet session.

CLI access using Telnet is not enabled by default. To enable access, use the set ha-mgmt-access command in the CLI (see CLI commands on page 19), or enable Telnet access on the interface in the GUI (see Interfaces on page 30)

SSH

SSH provides secure access to the CLI. Connect to the port1 interface IP address (192.168.1.99 by default). Specify the user name admin or SSH will attempt to log on with your user name. For example:

$ ssh admin@192.168.1.99

At the password prompt press Enter. By default there is no password. When you are finished, use the exit command to end the session.


Having trouble configuring your Fortinet hardware or have some questions you need answered? Check Out The Fortinet Guru Youtube Channel! Want someone else to deal with it for you? Get some consulting from Fortinet GURU!

Fortinet FortiGate 6040E

FortiGate 6040E

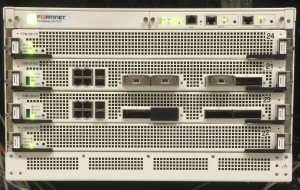
In case you guys haven’t heard the news yet, Fortinet has released the FortiGate 6040E. This is a pretty handy firewall that helps Enterprise organizations achieve the level of UTM/NGFW functionality they need without having to spend obscene amounts of money on hardware capable.

Fortinet FortiGate 6040E

Fortinet FortiGate 6040E

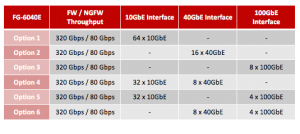
This device is substantially stronger, has modified management capabilities and can flow 320 Gbps of firewall throughput (80 Gbps UTM/NGFW). The FortiGate 6040E has 6 available options right now that you can see in the image below.

6 options are available for the FortiGate 6040E

6 options are available for the FortiGate 6040E

Fortinet’s blog has a really good break out of the device as well as the benefits and cool features it has. Click here to see!


Having trouble configuring your Fortinet hardware or have some questions you need answered? Check Out The Fortinet Guru Youtube Channel! Want someone else to deal with it for you? Get some consulting from Fortinet GURU!

Reports

Reports

FortiAnalyzer units can analyze information collected from the log files of managed log devices. It then presents the information in tabular and graphical reports that provide a quick and detailed analysis of activity on your networks.

To reduce the number of reports needed, reports are independent from devices, and contain layout information in the form of a report template. The devices, and any other required information, can be added as parameters to the report at the time of report generation.

The Reports tab allows you to configure reports using the predefined report templates, configure report schedules, view report history and the report calendar, and configure and view charts, macros, datasets, and output profiles.

If ADOMs are enabled, each ADOM will have its own report settings including chart library, macro library, dataset library, and output profiles.

FortiCache, FortiMail and FortiWeb reports are available when ADOMs are enabled. Reports for these devices are configured within their respective default ADOM. These devices also have device specific charts and datasets.

This chapter contains the following sections:

  • Reports
  • Report layouts
  • Chart library
  • Macro library
  • Report calendar
  • Advanced

Reports

FortiAnalyzer includes preconfigured reports and report templates for FortiGate, FortiMail, and FortiWeb log devices. These report templates can be used as is, or you can clone and edit the templates. You can also create new reports and report templates that can be customized to your requirements. For a list of preconfigured reports see “Report Templates” on page 207.

Predefined report templates are identified by a blue report icon,             , and custom report templates are identified by a green report icon,    . When a schedule has been enabled, the schedule icon,            , will appear to the left of the report template name.


In the Reports tab, go to Reports > [report] to view and configure the report configuration, advanced settings, and layout, and to view completed reports. The currently running reports and completed reports are shown in the View Report tab, see “View report tab” on page 173.

Figure 118:Report page

Right-clicking on a template in the tree menu opens a pop-up menu with the following options:

Report  
 Create New Create a new report. See “To create a new report:” on page 167.

Custom report templates are identified by the custom report icon,             , beside the report name. Predefined report templates are identified by the predefined report icon,           .

Rename              Rename a report.

 Clone Clone the selected report. See “To clone a report:” on page 167.
 Delete Delete the report. The default reports cannot be deleted. See “To delete a report:” on page 167.
 Import Import a report. See “Import and export” on page 167.

Export                Export a report. See “Import and export” on page 167.

Folder  
 Create New Create a new report folder. See “To create a new report folder:” on page 168.

Rename    Rename a report folder. See “To rename a report folder:” on page 168.

Delete                  Delete a report folder. Any report templates in the folder will be deleted. See “To delete a report folder:” on page 168.

Reports and report templates can be created, edited, cloned, and deleted. You can also import and export report templates. New content can be added to and organized on a template, including: new sections, three levels of headings, text boxes, images, charts, and line and page breaks.

To create a new report:

  1. In the Reports tab, right-click on Reports in the tree menu.
  2. Under the Report heading, select Create New.

The Create New Report dialog box opens.

  1. Enter a name for the new report and select OK.
  2. Configure report settings in the Configuration tab. The configuration tab includes time period, device selection, report type, schedule, and notifications.
  3. Select the Report layouts to configure the report template.
  4. Select the Advanced settings tab to configure report filters and other advanced settings.
  5. Select Apply to save the report template.

To clone a report:

  1. Right-click on the report you would like to clone in the tree menu and select Clone.

The Clone Report Template dialog box opens.

  1. Enter a name for the new template, then select OK.

A new template with the same information as the original template is created with the given name. You can then modify the cloned report as required.

To delete a report:

  1. Right-click on the report template that you would like to delete in the tree menu, and select Delete under the Report
  2. In the confirmation dialog box, select OK to delete the report template.

Import and export

Report templates can be imported from and exported to the management computer.

To import a report template:

  1. Right-click on Reports, and select Import.

The Import Report Template dialog box opens.

  1. Select Browse, locate the report template (.dat) file on your management computer, and select OK.

The report template will be loaded into the FortiAnalyzer unit.

To export a report template:

  1. Right-click on the report you would like to export in the tree menu and select Export.
  2. If a dialog box opens, select to save the file (.dat) to your management computer, and select OK.

The report template can now be imported to another FortiAnalyzer device.

Report folders

Report folders can be used to help organize your reports.

To create a new report folder:

  1. In the Reports tab, right-click on Reports in the tree menu.
  2. Under the Folder heading, select Create New.
  3. In the Create New Folder dialog box, enter a name for the folder, and select OK.

A new folder is created with the given name.

To rename a report folder:

  1. Right-click on the report folder that you need to rename in the tree menu.
  2. Under the Folder heading, select Rename.
  3. In the Rename Folder dialog box, enter a new name for the folder, and select OK.

To delete a report folder:

  1. Right-click on the report folder that you would like to delete in the tree menu, and select Delete under the Folder
  2. In the confirmation dialog box, select OK to delete the report folder.

Configuration tab

In FortiAnalyzer v5.2.0 and later, the Reports tab layout has changed. When creating a new report, the Configuration tab is the first tab that is displayed. In this tab you can configure the time period, select devices, enable schedules, and enable notification.

Report schedules provide a way to schedule an hourly, daily, weekly, or monthly report so that the report will be generated at a specific time. You can also manually run a report schedule at any time, and enable or disable report schedules. Report schedules can also be edited and disabled from the Report Calendar. See “Report calendar” on page 198 for more information.

Figure 119:Configuration tab

The following settings are available in the Configuration tab:

Time Period The time period that the report will cover. Select a time period, or select Other to manually specify the start and end date and time.
Devices The devices that the report will include. Select either All Devices or Specify to add specific devices. Select the add icon,        , to select devices.
User or IP Enter the user name or the IP address of the user on whom the report will be based.

This field is only available for the three predefined report templates in the Detailed User Report folder.

Type Select either Single Report (Group Report) or Multiple Reports (Per-Device).

This option is only available if multiple devices are selected.

Enable Schedule Select to enable report template schedules.
Generate PDF

Report Every

Select when the report is generated.

Enter a number for the frequency of the report based on the time period selected from the drop-down list.

Starts On Enter a starting date and time for the file generation.
Ends Enter an ending date and time for the file generation, or set it for never ending.
Enable Notification Select to enable report notification.
Output Profile Select the output profile from the drop-down list, or select Create New, , to create a new output profile. See “Output profile” on page 203.

Having trouble configuring your Fortinet hardware or have some questions you need answered? Check Out The Fortinet Guru Youtube Channel! Want someone else to deal with it for you? Get some consulting from Fortinet GURU!

Event Management

Event Management

In the Event Management tab you can configure events handlers based on log type and logging filters. You can select to send the event to an email address, SNMP community, or syslog server. Events can be configured per device, for all devices, or for the local FortiAnalyzer. You can create event handlers for FortiGate and FortiCarrier devices. In v5.2.0 or later, Event Management supports local FortiAnalyzer event logs.

Events can also be monitored, and the logs associated with a given event can be viewed.

Events

The events page provides a list of the generated events. Right-clicking on an event in the table gives you the option of viewing event details including the raw log entries associated with that event, adding review notes, and acknowledging the event.

To view events, go to the Event Management tab and select Event Management > All Events. You can also view events by severity and by handler. When ADOMs are enabled, select the ADOM, and then select All Events.

Figure 112:Events page


The following information is displayed:

Time Period Select a time period from the drop-down list. Select one of: Last 30 mins, Last 1 hour, Last 4 hours, Last 12 hours, Last 1 day, Last 7 days, Last N hours, Last N days, All.

If applicable, enter the number of days or hours for N in the N text box.

Show

Acknowledged

Select to show or hide acknowledged events. Acknowledged events are greyed out in the list.
Search Search for a specific event.
Count The number of log entries associated with the event. Click the heading to sort events by count.
Event Name The name of the event. Click the heading to sort events by event name.
Severity The severity level of the event. Event severity level is a user configured variable. The severity can be Critical, High, Medium, or Low. Click the heading to sort events by severity.
Event Type The event type. For example, Traffic or Event. Click the heading to sort events by event type.
Additional Info Additional information about the event. Click the heading to sort events by additional information.
Last Occurrence The date and time that the event was created and added to the events page. Click the heading to sort events by last occurrence.
Pagination Adjust the number of logs that are listed per page and browse through the pages.

Right-click on an event in the list to open the right-click menu. The following options are available:

 View Details The Event Details page is displayed. See “Event details” on page 153.
 Acknowledge Acknowledge an event. If Show Acknowledge is not selected, the event will be hidden. See “Acknowledge events” on page 154.

Event details

Event details provides a summary of the event including the event name, severity, type, count, additional information, last occurrence, device, event handler, raw log entries, and review notes. You can also acknowledge and print events in this page.

To view log messages associated with an event:

  1. In the events list, either double-click on an event or right-click on an event then select View Details in the right-click menu.

The Event Details page opens.

Figure 113:Event details page

  1. The following information and options are available:
 Print Select the print icon to print the event details page. The log details pane is not printed.
 Return Select the return icon to return to the All Events page.
Event Name The name of the event, also displayed in the title bar.
Severity The severity level configured for the event handler.
Type The event category of the event handler.
Count The number of logged events associated with the event.
Additional Info This field either displays additional information for the event or a link to the FortiGuard Encyclopedia. A link will be displayed for AntiVirus, Application Control, and IPS event types.
Last Occurrence The date and time of the last occurrence.
Device The device hostname associated with the event.
Event Handler The name of the event handler associated with the event. Select the link to edit the event handler. See “Event handler” on page 155.
Text box Optionally, you can enter a 1023 character comment in the text field. Select the save icon, , to save the comment, or cancel, , to cancel your changes.
Logs The logs associated with the log event are displayed. The columns and log fields are dependent on the event type.
Pagination Adjust the number of logs that are listed per page and browse through the pages.
Log details Log details are shown in the lower content pane for the selected log. The details will vary based on the log type.
  1. Select the return icon, , to return to the All Events

Acknowledge events

You can select to acknowledge events to remove them from the event list. An option has been added to this page to allow you to show or hide these acknowledged events.

To acknowledge events:

  1. From the event list, select the event or events that you would like to acknowledge.
  2. Right-click and select Acknowledge in the right-click menu.

Select the Show Acknowledge checkbox in the toolbar to view acknowledged events.


Having trouble configuring your Fortinet hardware or have some questions you need answered? Check Out The Fortinet Guru Youtube Channel! Want someone else to deal with it for you? Get some consulting from Fortinet GURU!

What’s New in FortiAnalyzer V5.2

What’s New in FortiAnalyzer v5.2

FortiAnalyzer v5.2 includes the following new features and enhancements.

FortiAnalyzer v5.2.0

FortiAnalyzer v5.2.0 includes the following new features and enhancements.

Event Management

  • Event Handler for local FortiAnalyzer event logs
  • FortiOS v4.0 MR3 logs are now supported.
  • Support subject customization of alert email.

FortiView

  • New FortiView module

Logging

  • Updated compact log v3 format from FortiGate • Explicit proxy traffic logging support
  • Improved FortiAnalyzer insert rate performance
  • Log filter improvements
  • FortiSandbox logging support
  • Syslog server logging support

Reports

  • Improvements to report configuration
  • Improvements to the Admin and System Events Report template
  • Improvements to the VPN Report template
  • Improvements to the Wireless PCI Compliance Report template
  • Improvements to the Security Analysis Report template
  • New Intrusion Prevention System (IPS) Report template
  • New Detailed Application Usage and Risk Report template
  • New FortiMail Analysis Report template
  • New pre-defined Application and Websites report templates
  • Macro library support
  • Option to display or upload reports in HTML format
  • FortiCache reporting support


Other


Having trouble configuring your Fortinet hardware or have some questions you need answered? Check Out The Fortinet Guru Youtube Channel! Want someone else to deal with it for you? Get some consulting from Fortinet GURU!

Setup for Email Users

Setup for email users

This section contains information that you may need to inform or assist your email users so that they can use FortiMail features.

This information is not the same as what is included in the help for FortiMail webmail. It is included in the Administration Guide because:

  • Email users may require some setup before they can access the help for FortiMail webmail.
  • Some information may be too technical for some email users.
  • Email users may not be aware that their email has been scanned by a FortiMail unit, much less where to get documentation for it.
  • Email users may not know which operation mode you have configured.
  • Email users may be confused if they try to access a feature, but you have not enabled it (such as Bayesian scanning or their personal quarantine).
  • You may need to tailor some information to your network or email users.

This section includes:

  • Training Bayesian databases
  • Managing tagged spam
  • Accessing the personal quarantine and webmail
  • Sending email from an email client (gateway and transparent mode)

Training Bayesian databases

Bayesian scanning can be used by antispam profiles to filter email for spam. In order to be accurate, the Bayesian databases that are at the core of this scan must be trained. This is especially important when the databases are empty.

Administrators can provide initial training. For details, see “Training the Bayesian databases” on page 645. If you have enabled it (see “Configuring the Bayesian training control accounts” on page 654 and “Accept training messages from users” on page 511), email users can also contribute to training the Bayesian databases.

To help to improve the accuracy of the database, email users selectively forward email to the FortiMail unit. These email are used as models of what is or is not spam. When it has seen enough examples to become more accurate at catching spam, a Bayesian database is said to be well-trained.

For example, if the local domain is example.com, and the Bayesian control email addresses are the default ones, an administrator might provide the following instructions to his or her email users.

Page 719

To train your antispam filters

  1. Initially, forward a sample set of spam and non-spam messages.
    • If you have collected spam, such as in a junk mail folder, and want to train your personal antispam filters, forward them to learn-is-spam@example.com from your email account. Similar email will be recognized as spam.
    • If you have collected non-spam email, such as your inbox or archives, and want to train your personal spam filters, forward them to learn-is-not-spam@example.com from your email account. Similar email will be recognized as legitimate email.
  2. On an ongoing basis, to fine-tune your antispam filters, forward any corrections — spam that was mistaken for legitimate email, or email that was mistaken for spam.
    • Forward undetected spam to is-spam@example.com from your email account.
    • Forward legitimate email that was mistaken for spam to is-not-spam@example.com from your email account.
    • If you belong to an alias and receive spam that was sent to the alias address, forward it to is-spam@example.com to train the alias’s database. Remember to enter the alias, instead of your own email address, in the From:

This helps your antispam filters to properly distinguish similar email/spam in the future.

Managing tagged spam

Instead of detaining an email in the system or personal quarantine, the administrator can configure the FortiMail unit to tag the subject line or header of an email that is detected as spam. For details, see “Configuring antispam action profiles” on page 516.

Once spam is tagged, the administrator notifies email users of the text that comprises the tag. Email users can then set up a rule-based folder in their email clients to automatically collect the spam based on tags.

For example, if spam subject lines are tagged with “SPAM”, email users can make a spam folder in their email client, then make filter rules in their email clients to redirect all email with this tag from their inbox into the spam folder.

Methods to create mailbox folders and filter rules vary by email client. For instructions, see your email client’s documentation.


Having trouble configuring your Fortinet hardware or have some questions you need answered? Check Out The Fortinet Guru Youtube Channel! Want someone else to deal with it for you? Get some consulting from Fortinet GURU!

Installing Firmware

Installing firmware

Fortinet periodically releases FortiMail firmware updates to include enhancements and address issues. After you have registered your FortiMail unit, FortiMail firmware is available for download at http://support.fortinet.com.

Installing new firmware can overwrite antivirus and antispam packages using the versions of the packages that were current at the time that the firmware image was built. To avoid repeat updates, update the firmware before updating your FortiGuard packages.

New firmware can also introduce new features which you must configure for the first time.

For information specific to the firmware release version, see the Release Notes available with that release.

In addition to major releases that contain new features, Fortinet releases patch releases that resolve specific issues without containing new features and/or changes to existing features. It is recommended to download and install patch releases as soon as they are available.

Before you can download firmware updates for your FortiMail unit, you must first register your FortiMail unit with Fortinet Technical Support. For details, go to http://support.fortinet.com/ or contact Fortinet Technical Support.

This section includes:

  • Testing firmware before installing it
  • Installing firmware
  • Clean installing firmware

Having trouble configuring your Fortinet hardware or have some questions you need answered? Check Out The Fortinet Guru Youtube Channel! Want someone else to deal with it for you? Get some consulting from Fortinet GURU!

Logs, Reports, and Alerts

Logs, reports and alerts

The Log and Report menu lets you configure logging, reports, and alert email.

FortiMail units provide extensive logging capabilities for virus incidents, spam incidents and system events. Detailed log information and reports provide analysis of network activity to help you identify security issues and reduce network misuse and abuse.

Logs are useful when diagnosing problems or when you want to track actions the FortiMail unit performs as it receives and processes traffic.

This section includes:

  • About FortiMail logging
  • Configuring logging
  • Configuring report profiles and generating reports
  • Configuring alert email
  • Viewing log messages
  • Viewing generated reports

About FortiMail logging

FortiMail units can log many different email activities and traffic including:

  • system-related events, such as system restarts and HA activity
  • virus detections
  • spam filtering results
  • POP3, SMTP, IMAP and webmail events

You can select which severity level an activity or event must meet in order to be recorded in the logs. For more information, see “Log message severity levels” on page 668.

A FortiMail unit can save log messages to its hard disk or a remote location, such as a Syslog server or a Fortinet FortiAnalyzer unit. For more information, see “Configuring logging” on page 671. It can also use log messages as the basis for reports. For more information, see “Configuring report profiles and generating reports” on page 676.

Accessing FortiMail log messages

There are several ways you can access FortiMail log messages:

  • On the FortiMail web UI, you can view log messages by going to Monitor > Log. For details, see the FortiMail Administration Guide.
  • On the FortiMail web UI, under Monitor > Log, you can download log messages to your local PC and view them later.
  • You can send log messages to a FortiAnalyzer unit by going to Log and Report > Log Settings > Remote Log Settings and view them on FortiAnalyzer.
  • You can send log messages to any Syslog server by going to Log and Report > Log Settings > Remote Log Settings.

Having trouble configuring your Fortinet hardware or have some questions you need answered? Check Out The Fortinet Guru Youtube Channel! Want someone else to deal with it for you? Get some consulting from Fortinet GURU!