Category Archives: FortiAnalyzer

Late Night Vulnerability Scare

About to head to bed but figured I would pass this little tid bit on. Fortinet devices (FortiAnalyzer and FortiManager) are affected by PSIRT ID: 1624489. This information is thanks to Mr. Nifty on the Fortinet Reddit.

The information he was able to pull from Fortinet is as follows:

Only affects FAZ and FMG systems. Patched in 5.0.12, 5.2.6 and 5.4.1 (still not released). No work-arounds. Medium threat level (3.7), client-side XSS vulnerability in their CSS code.

Public disclosure has not happened because they are still confirming affected code, working on releasing latest 5.4.1, and apparently it may overlap with other PSIRT cases. So FortiNet is still researching it basically.

So, if you wanted to be nervous about your Fortinet hardware right before heading to bed then go ahead. I’m probably about to drink a beer and pass out myself. Click Here To Read The Reddit Post


Having trouble configuring your Fortinet hardware or have some questions you need answered? Check Out The Fortinet Guru Youtube Channel! Want someone else to deal with it for you? Get some consulting from Fortinet GURU!

Custom FortiAnalyzer Report To See Blocked URLs for a Category

Ian on Fortinet’s forums asked a good question. You can see the question below:

Hi

I want to create a report that allows me to select a category and then to list all the activity for users where the URLS match that category. For example a report that lists user name, source IP, date time, url for the “Explicit Violence” category.

I have had a look at the datasets but my SQL coding is not to good 🙁

Has anyone tried this or any tips on what I need to do.

Regards

Ian

This is an awesome question and would be an incredible report to have right? Well, CrisP replied with an incredible solution to this issue.

Hello Ian,
I hate unanswered questions on a forum like this…
So here you have my two pennies on this.

Create a new dataset using
==============================
select
from_dtime(dtime) as timestamp, user_src, catdesc, hostname as website,
action as status, sum(bandwidth) as bandwidth
from
###(
select coalesce(nullifna(`user`), ipstr(`srcip`)) as user_src,
dtime, catdesc, hostname, utmaction as action,
sum(coalesce(sentbyte, 0)+coalesce(rcvdbyte, 0)) as bandwidth
from $log-traffic
where $filter and
hostname is not null and
logid_to_int(logid) not in (4, 7, 14) and ((logver>=52 and countweb>0)
or
((logver is null) and utmevent in (‘webfilter’, ‘banned-word’, ‘web-content’,
‘command-block’, ‘script-filter’)))
group by user_src, dtime, catdesc, hostname, utmaction
order by dtime desc
)### t
group by user_src, dtime, catdesc, website, status
order by dtime desc
===================================
(slightly modified from default dataset called “web-Detailed-Website-Browsing-Log”)
then build a new chart using the dataset, and a report using that chart.

Use a filter specifying the categories you want to detail in the Advanced settings of the report.

Now, if you really need the URLs, the story becomes quite ugly. You could see the post called “URL field” in this forum.
Best regards and good luck

CategBrowsingDetail-AdvSettings

CategBrowsingDetail


Having trouble configuring your Fortinet hardware or have some questions you need answered? Check Out The Fortinet Guru Youtube Channel! Want someone else to deal with it for you? Get some consulting from Fortinet GURU!

Reports

Reports

FortiAnalyzer units can analyze information collected from the log files of managed log devices. It then presents the information in tabular and graphical reports that provide a quick and detailed analysis of activity on your networks.

To reduce the number of reports needed, reports are independent from devices, and contain layout information in the form of a report template. The devices, and any other required information, can be added as parameters to the report at the time of report generation.

The Reports tab allows you to configure reports using the predefined report templates, configure report schedules, view report history and the report calendar, and configure and view charts, macros, datasets, and output profiles.

If ADOMs are enabled, each ADOM will have its own report settings including chart library, macro library, dataset library, and output profiles.

FortiCache, FortiMail and FortiWeb reports are available when ADOMs are enabled. Reports for these devices are configured within their respective default ADOM. These devices also have device specific charts and datasets.

This chapter contains the following sections:

  • Reports
  • Report layouts
  • Chart library
  • Macro library
  • Report calendar
  • Advanced

Reports

FortiAnalyzer includes preconfigured reports and report templates for FortiGate, FortiMail, and FortiWeb log devices. These report templates can be used as is, or you can clone and edit the templates. You can also create new reports and report templates that can be customized to your requirements. For a list of preconfigured reports see “Report Templates” on page 207.

Predefined report templates are identified by a blue report icon,             , and custom report templates are identified by a green report icon,    . When a schedule has been enabled, the schedule icon,            , will appear to the left of the report template name.


In the Reports tab, go to Reports > [report] to view and configure the report configuration, advanced settings, and layout, and to view completed reports. The currently running reports and completed reports are shown in the View Report tab, see “View report tab” on page 173.

Figure 118:Report page

Right-clicking on a template in the tree menu opens a pop-up menu with the following options:

Report  
 Create New Create a new report. See “To create a new report:” on page 167.

Custom report templates are identified by the custom report icon,             , beside the report name. Predefined report templates are identified by the predefined report icon,           .

Rename              Rename a report.

 Clone Clone the selected report. See “To clone a report:” on page 167.
 Delete Delete the report. The default reports cannot be deleted. See “To delete a report:” on page 167.
 Import Import a report. See “Import and export” on page 167.

Export                Export a report. See “Import and export” on page 167.

Folder  
 Create New Create a new report folder. See “To create a new report folder:” on page 168.

Rename    Rename a report folder. See “To rename a report folder:” on page 168.

Delete                  Delete a report folder. Any report templates in the folder will be deleted. See “To delete a report folder:” on page 168.

Reports and report templates can be created, edited, cloned, and deleted. You can also import and export report templates. New content can be added to and organized on a template, including: new sections, three levels of headings, text boxes, images, charts, and line and page breaks.

To create a new report:

  1. In the Reports tab, right-click on Reports in the tree menu.
  2. Under the Report heading, select Create New.

The Create New Report dialog box opens.

  1. Enter a name for the new report and select OK.
  2. Configure report settings in the Configuration tab. The configuration tab includes time period, device selection, report type, schedule, and notifications.
  3. Select the Report layouts to configure the report template.
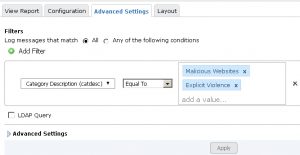
  4. Select the Advanced settings tab to configure report filters and other advanced settings.
  5. Select Apply to save the report template.

To clone a report:

  1. Right-click on the report you would like to clone in the tree menu and select Clone.

The Clone Report Template dialog box opens.

  1. Enter a name for the new template, then select OK.

A new template with the same information as the original template is created with the given name. You can then modify the cloned report as required.

To delete a report:

  1. Right-click on the report template that you would like to delete in the tree menu, and select Delete under the Report
  2. In the confirmation dialog box, select OK to delete the report template.

Import and export

Report templates can be imported from and exported to the management computer.

To import a report template:

  1. Right-click on Reports, and select Import.

The Import Report Template dialog box opens.

  1. Select Browse, locate the report template (.dat) file on your management computer, and select OK.

The report template will be loaded into the FortiAnalyzer unit.

To export a report template:

  1. Right-click on the report you would like to export in the tree menu and select Export.
  2. If a dialog box opens, select to save the file (.dat) to your management computer, and select OK.

The report template can now be imported to another FortiAnalyzer device.

Report folders

Report folders can be used to help organize your reports.

To create a new report folder:

  1. In the Reports tab, right-click on Reports in the tree menu.
  2. Under the Folder heading, select Create New.
  3. In the Create New Folder dialog box, enter a name for the folder, and select OK.

A new folder is created with the given name.

To rename a report folder:

  1. Right-click on the report folder that you need to rename in the tree menu.
  2. Under the Folder heading, select Rename.
  3. In the Rename Folder dialog box, enter a new name for the folder, and select OK.

To delete a report folder:

  1. Right-click on the report folder that you would like to delete in the tree menu, and select Delete under the Folder
  2. In the confirmation dialog box, select OK to delete the report folder.

Configuration tab

In FortiAnalyzer v5.2.0 and later, the Reports tab layout has changed. When creating a new report, the Configuration tab is the first tab that is displayed. In this tab you can configure the time period, select devices, enable schedules, and enable notification.

Report schedules provide a way to schedule an hourly, daily, weekly, or monthly report so that the report will be generated at a specific time. You can also manually run a report schedule at any time, and enable or disable report schedules. Report schedules can also be edited and disabled from the Report Calendar. See “Report calendar” on page 198 for more information.

Figure 119:Configuration tab

The following settings are available in the Configuration tab:

Time Period The time period that the report will cover. Select a time period, or select Other to manually specify the start and end date and time.
Devices The devices that the report will include. Select either All Devices or Specify to add specific devices. Select the add icon,        , to select devices.
User or IP Enter the user name or the IP address of the user on whom the report will be based.

This field is only available for the three predefined report templates in the Detailed User Report folder.

Type Select either Single Report (Group Report) or Multiple Reports (Per-Device).

This option is only available if multiple devices are selected.

Enable Schedule Select to enable report template schedules.
Generate PDF

Report Every

Select when the report is generated.

Enter a number for the frequency of the report based on the time period selected from the drop-down list.

Starts On Enter a starting date and time for the file generation.
Ends Enter an ending date and time for the file generation, or set it for never ending.
Enable Notification Select to enable report notification.
Output Profile Select the output profile from the drop-down list, or select Create New, , to create a new output profile. See “Output profile” on page 203.

Having trouble configuring your Fortinet hardware or have some questions you need answered? Check Out The Fortinet Guru Youtube Channel! Want someone else to deal with it for you? Get some consulting from Fortinet GURU!

Event Management

Event Management

In the Event Management tab you can configure events handlers based on log type and logging filters. You can select to send the event to an email address, SNMP community, or syslog server. Events can be configured per device, for all devices, or for the local FortiAnalyzer. You can create event handlers for FortiGate and FortiCarrier devices. In v5.2.0 or later, Event Management supports local FortiAnalyzer event logs.

Events can also be monitored, and the logs associated with a given event can be viewed.

Events

The events page provides a list of the generated events. Right-clicking on an event in the table gives you the option of viewing event details including the raw log entries associated with that event, adding review notes, and acknowledging the event.

To view events, go to the Event Management tab and select Event Management > All Events. You can also view events by severity and by handler. When ADOMs are enabled, select the ADOM, and then select All Events.

Figure 112:Events page


The following information is displayed:

Time Period Select a time period from the drop-down list. Select one of: Last 30 mins, Last 1 hour, Last 4 hours, Last 12 hours, Last 1 day, Last 7 days, Last N hours, Last N days, All.

If applicable, enter the number of days or hours for N in the N text box.

Show

Acknowledged

Select to show or hide acknowledged events. Acknowledged events are greyed out in the list.
Search Search for a specific event.
Count The number of log entries associated with the event. Click the heading to sort events by count.
Event Name The name of the event. Click the heading to sort events by event name.
Severity The severity level of the event. Event severity level is a user configured variable. The severity can be Critical, High, Medium, or Low. Click the heading to sort events by severity.
Event Type The event type. For example, Traffic or Event. Click the heading to sort events by event type.
Additional Info Additional information about the event. Click the heading to sort events by additional information.
Last Occurrence The date and time that the event was created and added to the events page. Click the heading to sort events by last occurrence.
Pagination Adjust the number of logs that are listed per page and browse through the pages.

Right-click on an event in the list to open the right-click menu. The following options are available:

 View Details The Event Details page is displayed. See “Event details” on page 153.
 Acknowledge Acknowledge an event. If Show Acknowledge is not selected, the event will be hidden. See “Acknowledge events” on page 154.

Event details

Event details provides a summary of the event including the event name, severity, type, count, additional information, last occurrence, device, event handler, raw log entries, and review notes. You can also acknowledge and print events in this page.

To view log messages associated with an event:

  1. In the events list, either double-click on an event or right-click on an event then select View Details in the right-click menu.

The Event Details page opens.

Figure 113:Event details page

  1. The following information and options are available:
 Print Select the print icon to print the event details page. The log details pane is not printed.
 Return Select the return icon to return to the All Events page.
Event Name The name of the event, also displayed in the title bar.
Severity The severity level configured for the event handler.
Type The event category of the event handler.
Count The number of logged events associated with the event.
Additional Info This field either displays additional information for the event or a link to the FortiGuard Encyclopedia. A link will be displayed for AntiVirus, Application Control, and IPS event types.
Last Occurrence The date and time of the last occurrence.
Device The device hostname associated with the event.
Event Handler The name of the event handler associated with the event. Select the link to edit the event handler. See “Event handler” on page 155.
Text box Optionally, you can enter a 1023 character comment in the text field. Select the save icon, , to save the comment, or cancel, , to cancel your changes.
Logs The logs associated with the log event are displayed. The columns and log fields are dependent on the event type.
Pagination Adjust the number of logs that are listed per page and browse through the pages.
Log details Log details are shown in the lower content pane for the selected log. The details will vary based on the log type.
  1. Select the return icon, , to return to the All Events

Acknowledge events

You can select to acknowledge events to remove them from the event list. An option has been added to this page to allow you to show or hide these acknowledged events.

To acknowledge events:

  1. From the event list, select the event or events that you would like to acknowledge.
  2. Right-click and select Acknowledge in the right-click menu.

Select the Show Acknowledge checkbox in the toolbar to view acknowledged events.


Having trouble configuring your Fortinet hardware or have some questions you need answered? Check Out The Fortinet Guru Youtube Channel! Want someone else to deal with it for you? Get some consulting from Fortinet GURU!

FortiView

FortiView

The FortiView tab allows you to access both FortiView drill down and Log view menus. FortiView in FortiAnalyzer collects data from FortiView in FortiGate. In order for information to appear in the FortiView dashboards in FortiGate, disk logging must be selected for the FortiGate unit. Select the FortiView tab and select the ADOM from the drop-down list.

FortiView

Use FortiView to drill down real-time and historical traffic from log devices by sources, applications, destinations, web sites, threats, and cloud applications. Each FortiView can be filtered by a variety of attributes, as well as by device and time period. These attributes can be selected using the right-click context menu. Results can also be filtered using the various columns.

The following FortiViews are available:

  • Top sources
  • Top applications
  • Top destinations
  • Top web sites
  • Top threats
  • Top cloud applications

Top sources

The Top Sources dashboard displays information about the sources of traffic on your unit. You can drill down the displayed information, and also select the device and time period, and apply search filters.

Figure 88:Top sources


The following information is displayed:

Source Displays the source IP address and/or user name, if applicable. Select the column header to sort entries by source. You can apply a search filter to the source (srcip) column.
Device Displays the device IP address or FQDN. Select the column header to sort entries by device. You can apply a search filter to the device (dev_src) column.
Threat Weight Displays the threat weight value. Select the column header to sort entries by threat weight.
Sessions Displays the number of sessions. Select the column header to sort entries by sessions.
Bandwidth

(Sent/Received)

Displays the bandwidth value for sent and received packets. Select the column header to sort entries by bandwidth.

The following options are available:

 Refresh Refresh the displayed information.
Search Click the search field to add a search filter for user (user), source IP (srcip), source device (dev_src), source interface (srcintf), destination interface (dstintf), policy ID (policyid), security action (utmaction), or virtual domain (vd). Select the GO button to apply the search filter. Alternatively, you can right-click the column entry to add the search filter. Select the clear icon, , to remove the search filter.
Devices Select the device from the drop-down list or select All Devices. Select the GO button to apply the device filter.
Time Period Select the time period from the drop-down list. Select Custom from the list to specify the start and end date and time. Select the GO button to apply the time period filter.
N When selecting a time period with last N in the entry, you can enter the value for N in this text field.
 Custom When Custom is selected the custom icon will be displayed. Select the icon to change the custom time period.
 Go Select the GO button to apply the filter.
Pagination Select the number of entries to display per page and browse pages.
Right-click menu  


 Application Select to drill down by application to view application related information including the application, number of sessions, and bandwidth (sent/received).

You can select to sort entries displayed by selecting the column header. You can apply a search filter in the application (app) column to further filter the information displayed. Select the GO button to apply the search filter.

Select the return icon, , to return to the Top Sources page.

 Destination Select to drill down by destination to view destination related information including the destination IP address and geographic region, the threat weight value, number of sessions, and bandwidth (sent/received).

You can select to sort entries displayed by selecting the column header. You can apply a search filter in the destination (dstip) column to further filter the information displayed. Select the GO button to apply the search filter.

Select the return icon, , to return to the Top Sources page.

 Threat Select to drill down by threat to view threat related information including the threat type, category, threat level, threat weight, and number of incidents.

You can select to sort entries displayed by selecting the column header. You can apply a search filter in the threat (threat) or category

(threattype) columns to further filter the information displayed. Select the GO button to apply the search filter.

Select the return icon, , to return to the Top Sources page.

 Domain Select to drill down by domain to view domain related information including domain, category, browsing time, threat weight, number of sessions, and bandwidth (sent/received).

You can select to sort entries displayed by selecting the column header. Select the GO button to apply the search filter.

Select the return icon, , to return to the Top Sources page.

 Category Select to drill down by category to view category related information including category, browsing time, threat weight, number of sessions, and bandwidth (sent/received).

You can select to sort entries displayed by selecting the column header. Select the GO button to apply the search filter.

Select the return icon, , to return to the Top Sources page.

 Sessions Select to drill down by sessions to view session related information including date/time, source/device, destination IP address and geographic region, service, bandwidth (sent/received), user, application, and security action.

You can select to sort entries displayed by selecting the column header. You can apply a search filter in the destination (dstip), service

(service), user (user), or application (app) columns to further filter the information displayed. Select the GO button to apply the search filter.

Select the return icon, , to return to the Top Sources page.

 Search Add a search filter by source IP (srcip) or source device (dev_src). Select the GO button to apply the filter. Select the clear icon,    , to remove the search filter.

Top applications

The Top Applications dashboard shows information about the applications being used on your network, including the application name, category, and risk level. You can drill down the displayed information, also select the device and time period, and apply search filters.

Figure 89:Top applications

The following information is displayed:

Application Displays the application port and service. Select the column header to sort entries by application. You can apply a search filter to the application (app) column.
Category Displays the application category. Select the column header to sort entries by category. You can apply a search filter to the category (appcat) column.
Risk Displays the application risk level. Hover the mouse cursor over the entry in the column for additional information. Select the column header to sort entries by category. Risk uses a new 5-point risk rating. The rating system is as follows:

•      Critical: Applications that are used to conceal activity to evade detection.

•      High: Applications that can cause data leakage, are prone to vulnerabilities, or downloading malware.

•      Medium: Applications that can be misused.

•      Elevated: Applications that are used for personal communications or can lower productivity.

•      Low: Business related applications or other harmless applications.

Sessions Displays the number of sessions. Select the column header to sort entries by sessions.
Bandwidth

(Sent/Received)

Displays the bandwidth value for sent and received packets. Select the column header to sort entries by bandwidth.

The following options are available:

 Refresh Refresh the displayed information.
Search Click the search field to add a search filter by application (app), source interface (srcintf), destination interface (dstintf), policy ID

(policyid), security action (utmaction), or virtual domain (vd). Select the GO button to apply the search filter. Alternatively, you can right-click the column entry to add the search filter. Select the clear icon, , to remove the search filter.

Devices Select the device from the drop-down list or select All Devices. Select the GO button to apply the device filter.
Time Period Select the time period from the drop-down list. Select Custom from the list to specify the start and end date and time. Select the GO button to apply the time period filter.
N When selecting a time period with last N in the entry, you can enter the value for N in this text field.
 Custom When Custom is selected the custom icon will be displayed. Select the icon to change the custom time period.
 Go Select the GO button to apply the filter.
Pagination Select the number of entries to display per page and browse pages.
Right-click menu  


 Source Select to drill down by source to view source related information including the source IP address, device MAC address or FQDN, threat weight, number of sessions, and bandwidth (sent/received).

You can select to sort entries displayed by selecting the column header. You can apply a search filter in the source (srcip) and device

(dev_src) columns to further filter the information displayed. Select the GO button to apply the search filter.

Select the return icon, , to return to the Top Applications page.

 Destination Select to drill down by destination to view destination related information including the destination IP address and geographic region, the threat weight value, number of sessions, and bandwidth (sent/received).

You can select to sort entries displayed by selecting the column header. You can apply a search filter in the destination (dstip) column to further filter the information displayed. Select the GO button to apply the search filter.

Select the return icon, , to return to the Top Applications page.

 Threat Select to drill down by threat to view threat related information including the threat type, category, threat level, threat weight, and number of incidents.

You can select to sort entries displayed by selecting the column header. You can apply a search filter in the threat (threat) or category

(threattype) columns to further filter the information displayed. Select the GO button to apply the search filter.

Select the return icon, , to return to the Top Applications page.

 Sessions Select to drill down by sessions to view session related information including date/time, source/device, destination IP address and geographic region, service, bandwidth (sent/received), user, application, and security action.

You can select to sort entries displayed by selecting the column header. You can apply a search filter in the destination (dstip), service

(service), user (user), or application (app) columns to further filter the information displayed. Select the GO button to apply the search filter.

Select the return icon, , to return to the Top Applications page.

 Search Add a search filter by application or category. Select the GO button to apply the filter. Select the clear icon,    , to remove the search filter.

Having trouble configuring your Fortinet hardware or have some questions you need answered? Check Out The Fortinet Guru Youtube Channel! Want someone else to deal with it for you? Get some consulting from Fortinet GURU!

System Settings

System Settings

The System Settings tab enables you to manage and configure system options for the FortiAnalyzer unit. This includes the basic network settings to connect the device to the corporate network, the configuration of administrators and their access privileges, and managing and updating firmware for the device

The System Settings tab provides access to the following menus and sub-menus:

 Dashboard Select this menu to configure, monitor, and troubleshoot your

FortiAnalyzer device. Dashboard widgets include: System Information,

License Information, Unit Operation, System Resources, Alert Message Console, CLI Console, Log Receive Monitor, Logs/Data Received, and Statistics.

 All ADOMs Select this menu to create new ADOMs and monitor all existing

ADOMs.

 RAID management Select this menu to configure and monitor your Redundant Array of Independent Disks (RAID) setup. This page displays information about the status of RAID disks as well as what RAID level has been selected.

It also displays how much disk space is currently consumed.

 Network Select this menu to configure your FortiAnalyzer interfaces. You can also view the IPv4/IPv6 Routing Table and access Diagnostic Tools.
 Admin Select this menu to configure administrator user accounts, as well as configure global administrative settings for the FortiAnalyzer unit.

•       Administrator

•       Profile

•       Remote authentication server

•       Administrator settings

 Certificates Select this menu to configure the following:

•       Local certificates

•       CA certificates

•       Certificate revocation lists


 Event log Select this menu to view FortiAnalyzer event log messages. On this page you can:

•      Download the logs in .log or .csv formats

•      View raw logs or logs in a formatted table

•      Browse the event log, FDS upload log, and FDS download log

 Task monitor Select this menu to monitor FortiAnalyzer tasks.
 Advanced Select to configure advanced settings.

•       SNMP v1/v2c

•       Mail server

•       Syslog server

•       Meta fields

•       Device log settings

•       File management

•       Advanced settings


Having trouble configuring your Fortinet hardware or have some questions you need answered? Check Out The Fortinet Guru Youtube Channel! Want someone else to deal with it for you? Get some consulting from Fortinet GURU!

Device Manager

Device Manager

The Device Manager tab allows you to add and edit devices and VDOMs, and view completed reports for devices and VDOMs.

Figure 9 shows the Device Manager tab.

Figure 9: Device manager tab

The tree menu shows the devices and VDOMs within the selected ADOM. If ADOMs are disabled, the tree menu simply shows the devices. When ADOMs are enabled, the ADOM is selected using the drop-down list in the toolbar.

The device and VDOM list can be searched using the search box in the content pane toolbar. The columns shown in the list can be customized, and the list can be sorted by selecting a column header.


To change the column settings:

  1. Right-click on a column heading in the content pane.

Columns currently included in the content pane table have a green check mark next them.

Figure 10:Column right-click menu

  1. Select a column from the list to add or remove that column from the table.

Select Reset to Default to reset the table to its default state

Devices

Devices are organized by device type. VDOMs and model devices can be created and deleted.

Devices and VDOMs

Device models can be added and deleted, devices can be edited, and VDOMs can be deleted. The Add Device wizard is used to add model devices.

To add a model device:

  1. Right-click on a group in the tree menu or in the content pane and, from the right-click menu, select Add Device, or, if ADOMs are not enabled, select Add Device from the toolbar.

The Add Device wizard opens.

Figure 11:Add device wizard login screen

  1. Enter the device IP address, user name, and password in the requisite fields.
  2. Select Next to continue to the next page of the wizard: Add Device.

Figure 12:Add device wizard add device screen

  1. Enter the following information:
Name Enter a name for the device.
Description Enter a description for the device (optional).
Device Type Select the device type from the drop-down list. Select FortiGate for FortiGate ADOMs, FortiSwitch for FortiSwitch ADOMs, etc.
Device Model Select the device model from the drop-down list.
Firmware Version Select the firmware version from the drop-down list.
HA Cluster Select if the device is part of a high availability cluster.
Serial Number Enter the device serial number. This value must match the device model selected.

When HA Cluster is enabled, you can enter the serial numbers of all members of the cluster.

Disk Log Quota

(min. 100MB)

Enter the disk log quota in MB.

This option is only available for certain device types.

When Allocated

Disk Space is Full

Select to overwrite the oldest logs or to stop logging when the allocated disk space is full.
Device Permissions Select the device permissions from: Logs, DLP Archive, Quarantine, and IPS Packet Log.
Other Device

Information

Enter other device information (optional), including:

Company/Organization, Contact, City, Province/State, and Country.

  1. Select Next to proceed to the next add device page.

Figure 13:Add device wizard add device screen two

  1. After the device has been created successfully, select Next to proceed to the summary page.

Figure 14:Add device wizard summary screen

  1. Select Finish to add the device model.

To edit a device:

  1. In the Device Manager tab, in the tree menu, select the group that contains the device you need to edit.
  2. In the content pane, right-click on the on the device and select Edit from the right-click menu.

The Edit Device dialog box opens.

Figure 15:Edit a device

  1. Edit the following information as needed:
Name The name of the device.
Description Descriptive information about the device.

Company/Organization Company or organization information.

Country Enter the country.
Province/State Enter the province or state.
City Enter the city.
Contact Enter the contact name.
IP Address The IP address of the device.
Admin User The administrator username.
Password The administrator password.
Device Information Information about the device, including serial number, device model, firmware version, connected interface.
HA Cluster Select if the device is part of a high availability cluster.
Serial No. When HA Cluster is enabled, you can enter the serial numbers of all members of the cluster.
Disk Log Quota (min.

100MB)

The amount of space that the disk log is allowed to use, in MB.
When Allocated Disk

Space is Full

The action for the system to take when the disk log quota is filled, either Overwrite Oldest Logs, or Stop Logging.
Secure Connection Select check box to enable this feature. Secure Connection secures Odette File Transfer Protocol (OFTP) traffic through an IPsec tunnel.
ID The device serial number.
Pre-Shared Key The pre-shared key for the IPsec connection between the FortiGate and FortiAnalyzer.
Device Permissions The device’s permissions. Select any of: Logs, DLP Archive, Quarantine, and IPS Packet Log.
  1. Select OK to finish editing the device.

To delete a device or VDOM:

  1. In the Device Manager tab, in the tree menu, select the group that contains the device or VDOM you need to delete.
  2. In the content pane, right-click on the on the device or VDOM and select Delete in the right-click menu.
  3. Select OK in the confirmation window to delete the device or VDOM.

Unregistered devices

In FortiAnalyzer v5.2.0 and later, the config system global set unregister-pop-up command is disabled by default. When a device is configured to send logs to FortiAnalyzer, the unregistered device table will not be displayed. Instead, a new entry named Unregistered Devices will appear in the Device Manager tab tree menu. You can then add devices to specific ADOMs or delete devices using the toolbar buttons or right-click menu.

Figure 16:Unregistered devices

Device reports

You can view, download, and delete device reports in the Device Manager content pane. Selecting a device or VDOM in the tree menu will display all reports associated with that device or VDOM in the content pane. For more information, see “View report tab” on page 173.

To view latest reports from the Device Manager tab:

  1. In the Device Manager tab select the ADOM that contains the device whose reports you would like to view from the drop-down list.
  2. Select the device or VDOM from the tree menu.
  3. The report history is shown in the content pane, showing a list of all the reports that have been run for that device or VDOM.

Figure 17:Report history

  1. In the Format column, select HTML to display the report in a browser window, or select PDF to download the report as a PDF file to your management computer.

Log forwarding

When your FortiAnalyzer device is configured in collector mode, you can configure log forwarding in the Device Manager tab. You can configure to forward logs for selected devices to another FortiAnalyzer, a syslog server, or a Common Event Format (CEF) server.

To put your FortiAnalyzer in collector mode:

  1. Go to System Settings > Dashboard.
  2. In the System Information widget, in the Operation Mode field, select [Change].
  3. In the Change Operation Mode dialog box, select Collector, and then select OK.

The Web-based Manager will refresh and the Device Manager, Log View, and System Settings tabs will be available. See “Changing the operation mode” on page 50 for more information.

To configure log forwarding:

  1. Go to the Device Manager tab and select Log Forwarding.
  2. Select Create New from the toolbar.

The Add log forwarding page is displayed.

Figure 18:Add log forwarding dialog box

  1. Configure the following settings:

Server Name             Enter a name to identify the remote server.

Remote Server Type Select the remote server type. Select one of the following: FortiAnalyzer, Syslog, Common Event Format (CEF).

Server IP Enter the server IP address.
Select Devices Select the add icon,       , to select devices. Select devices and select OK to add the devices.
Enable Log

Aggregation

Select to enable log aggregation. This option is only available when Remote Server Type is set to FortiAnalyzer.
Password Enter the server password.
Confirm

Password

Re-enter the server password.
Upload Daily at Select a time from the drop-down list.
Enable Real-time

Forwarding

Select to enable real-time log forwarding.
Level Select the logging level from the drop-down list. Select one of the following: Emergency, Alert, Critical, Error, Warning, Notification, Information, or Debug.
Server Port Enter the server port. When Remote Server Type is FortiAnalyzer, the port cannot be changed. The default port is 514.
  1. Select OK to save the setting.

Having trouble configuring your Fortinet hardware or have some questions you need answered? Check Out The Fortinet Guru Youtube Channel! Want someone else to deal with it for you? Get some consulting from Fortinet GURU!

Administrative Domains

Administrative Domains

When ADOMs are enabled, you must select the ADOM from the drop-down list in the toolbar.

The Device Manager, FortiView, Event Management, and Reports tab are displayed per ADOM. The devices within each ADOM are shown in the default All FortiGate group. When ADOMs are disabled, the tree menu simply displays All FortiGates and Unregistered Devices, if there are any. Non-FortiGate devices are grouped into their own specific ADOMs.

ADOMs are not enabled by default, and enabling and configuring the domains can only be performed by the admin administrator. The maximum number of ADOMs you can add depends on the specific FortiAnalyzer system model. Please refer to the FortiAnalyzer data sheet for information on the maximum number of devices and ADOMs that your model supports.

The number of devices within each group is shown in parentheses next to the group name.

  1. Log in as admin.
  2. Go to System Settings > Dashboard.
  3. In the System Information widget, select Enable next to Administrative Domain.
  4. Select OK in the confirmation dialog box to enable ADOMs.

To disable the ADOM feature:

  1. Remove all log devices from all non-root ADOMs.
  2. Delete all non-root ADOMs, by right-clicking on the ADOM in the tree menu in the Device Manager tab and selecting Delete from the pop-up menu.
  3. Go to System Settings > Dashboard.
  4. In the system information widget, select Disable next to Administrative Domain.
  5. Select OK in the confirmation dialog box to disable ADOMs.

Adding an ADOM

You can create both FortiGate and FortiCarrier ADOMs for versions 5.2, 5.0, and 4.3. FortiAnalyzer has default ADOMs for all non-FortiGate devices. When one of these devices is promoted to the DVM table, the device is added to their respective default ADOM and will be visible in the tree menu.

To add an ADOM:

  1. Go to System Settings > All ADOMs and select Create New in the toolbar.

Alternatively, in the Device Manager tab, from the ADOM drop-down list, select Manage ADOMs. In the Manage ADOMs window that opens, select Create New.

The Create ADOM dialog box opens.

Figure 7: Create an ADOM

  1. Enter the following information:
Name Enter an unique name that will allow you to distinguish this ADOM from your other ADOMs.
Device Type Select the device type from the drop-down list.
Version Select the firmware version of the devices that will be in the ADOM. Select one the following: 5.2, 5.0, or 4.3.
Search Enter a search term to find a specific device (optional).
Devices

Groups

Transfer devices, VDOMs, and groups from the available member list on the left to the selected member list on the right to assign those devices to the ADOM.
  1. Select OK to create the ADOM.

To edit an ADOM:

  1. Go to System Settings > All ADOMs, right-click on the ADOM you need to edit, and select Edit in the right-click menu.

Alternatively, in the Device Manager tab, from the ADOM drop-down list, select Manage ADOMs. In the Manage ADOMs window that opens, right-click on the ADOM you need to edit, and select Edit in the right-click menu.

The Edit ADOM dialog box opens.

Figure 8: Edit an ADOM

  1. Edit the following information as required:
Name Edit the ADOM name.
Device Type This field cannot be edited.
Version This field cannot be edited.
Search Enter a search term to find a specific device (optional).
Devices

Groups

Transfer devices VDOMs, and groups from the available member list on the left to the selected member list on the right to assign those devices to the ADOM.
Status Enable or disable the ADOM.
  1. Select OK to finish editing the ADOM.

To delete an ADOM:

  1. Go to System Settings > All ADOMs, right-click on the ADOM you need to delete, and select Delete in the right-click menu.
  2. Alternatively, in the Device Manager tab, from the ADOM drop-down list, select Manage ADOMs. In the Manage ADOMs window that opens, right-click on the ADOM you need to delete, and select Delete in the right-click menu.
  3. Select OK in the confirmation dialog box to delete the ADOM.

Assigning devices to an ADOM

The admin administrator selects the devices to be included in an ADOM. You cannot assign the same device to two different ADOMs.

To assign devices to an ADOM:

  1. Open the Edit ADOM dialog box (see “To edit an ADOM:” on page 29).
  2. From the Available member list, select which devices you want to associate with the ADOM and select the right arrow to move them to the Selected member

If the administrative device mode is Advanced, you can add separate FortiGate VDOMs to the ADOM as well as FortiGate units.

  1. When done, select OK. The selected devices appear in the device list for that ADOM.

Assigning administrators to an ADOM

The admin administrator can create other administrators and assign an ADOM to their account, constraining them to configurations and data that apply only to devices in their ADOM.

By default, when ADOMs are enabled, existing administrator accounts other than admin are assigned to the root domain, which contains all devices in the device list. For more information about creating other ADOMs, see “Adding an ADOM” on page 28.

To assign an administrator to an ADOM:

  1. Log in as admin.

Other administrators cannot configure administrator accounts when ADOMs are enabled.

  1. Go to System Settings > Admin > Administrator.
  2. Configure the administrator account, and select the Admin Domains that the administrator account will be able to use to access the FortiManager system.

See “Administrator” on page 75 for more information.

ADOM device modes

An ADOM has two device modes: normal and advanced. In normal mode, you cannot assign different FortiGate VDOMs to multiple FortiManager ADOMs. The FortiGate unit can only be added to a single ADOM.

In advanced mode, you can assign different VDOMs from the same FortiGate unit to multiple

ADOMs.

Advanced ADOM mode will allow users to assign VDOMs from a single device to different ADOMs, but will result in a reduced operation mode and more complicated management scenarios. It is recommended for advanced users only.

To change the ADOM mode, go to System Settings > Advanced > Advanced Settings and change the selection in the ADOM Mode field.

Alternatively, use the following command in the CLI:

config system global set adom-mode {normal | advanced}

end

Normal mode is the default setting. To change from advanced back to normal, you must ensure no FortiGate VDOMs are assigned to an ADOM.


Having trouble configuring your Fortinet hardware or have some questions you need answered? Check Out The Fortinet Guru Youtube Channel! Want someone else to deal with it for you? Get some consulting from Fortinet GURU!