Using the Web UI
Web UI Overview
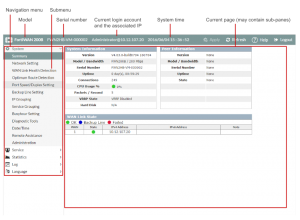
Once you log in, you will see the operating page that is divided into three parts, the header is locate the upper side of the screen, the navigation menu is located on the left side of the screen, and the content pane is located on the center of the screen.
Header contains information and items which is unrelated to FortiWAN’s functions.
- Current login account: Display the account you login as and the IP address you login from. l System Time: Display the FortiWAN’s system time.
- Current operating page: Display the path (Main category > Page name) of the operating page displayed in Content Pane.
- Apply: The button for applying configurations. Pages for only displaying information or statistics contains no Apply button.
- Reload: The button for reloading current operating page. l Help: The button for getting the Help information of current operating page. l Logout: The button for logging out Web UI.
[System/Summary] shown above indicates page contents are displayed of [System] > [Summary], and [Administrator@125.227.251.80] indicates Administrator account log in from IP 125.227.251.80. Note that do not use your browser’s Back button to navigate, pages may not operate correctly.
Navigation Menu consists of six main categories: System, Service, Statistics, Log, Reports and Language. Each category contains sub-menu of individual functions. To expand a category, simply click it.To display the operating page of a function from a sub-menu, click the name of the function and it will display on the content pane.
- System: Contains necessary items to maintain the FortiWAN; they are Summary, Network Setting, WAN Link
Health Detection, Optimum Route Detection, Port Speed/Duplex Setting, Backup Line Setting, IP Grouping,
Service Grouping, Busyhour Setting, Diagnostic Tools, Date/Time, Remote Assistance and Administration (See “System Configurations” and “Configuring Network Interface (Network Setting)”). Administration is not available to Monitor permission, it is invisible on the menu to a Monitor account.
- Service: Contains the services the FortiWAN provides; they are Firewall, NAT, Persistent Routing, Auto Routing,
Virtual Server, Bandwidth Management, Connection Limit, Cache Redirect, Multihoming, Internal DNS, DNS Proxy, SNMP, IP-MAC Mapping and Tunnel Routing (See “Load Balancing & Fault Tolerance” & “Optional
Services”).
- Statistics: Contains basic statistics of FortiWAN’s system, services and traffic; they are Traffic, BM, Persistent Routing, WAN Link Health Detection, Dynamic IP WAN Link, DHCP Lease Information, RIP & OSPF Status, Connection Limit, Virtual Server Status, FQDN, Tunnel Status and Tunnel Traffic (See “Statistics”).
- Log: Contains managements of system logs; they are View, Control, Notification and Reports (See “Log”).
- Reports: Contain the advanced analysis and long-term statistics of FortiWAN’s system, services and traffic; they are Bandwidth, CPU, Session, WAN Traffic, WAN Reliability, WAN Status, TR Reliability, TR Status, In Class, Out Class, WAN, Service, Internal IP, Traffic Rate, Connection Limit, Firewall, Virtual Server, Multihoming, Dashboard and Settings (See “Reports”).
- Language: Support English, Traditional Chinese and Simplified Chinese for options to display Web UI in multiple languages,
Content Pane displays related items of a function specified from the left menu.
Multi-user Login
FortiWAN’s Web UI supports multiple sign-in. The maximum limit for users can log-in concurrently is 20 users, account permission (See “Administration\Administrator and Monitor Password”) insensitive. An user get failed to log-in if there have been 20 users in the Web UI concurrently. FortiWAN Web UI does not accept multiple login from the same host and the same browser. Users that attempt to login to Web UI via the same host and browser (different tabs or windows) will be logged out (including the one who is already in Web UI).
Configurations to FortiWAN applied concurrently via Web UI by the multiple users are arranged and processed in order (one by one). It takes time for system to complete every single configuration applying; therefore, when multiple configurations are in the queue to be applied, it might take a little extra time to wait for system getting previous applications complete for the users after clicking the Apply button. Configurations to different functions are queued up together to be applied. For example, an configuration to Auto Routing (made by user A) will be queued if a configuration to Multihoming (made earlier by user B) has being processed.
FortiWAN does not provide multi-thread to run concurrent Tunnel Routing Benchmark (See “Tunnel Routing Benchmark”). An alert displays to the users who try to start Tunnel Routing Benchmark Client\Server via WebUI if the Benchmark Client\Server is already running (started earlier by one user).
Basic concept to configure via Web UI
FortiWAN’s services (load balancing, fault tolerance and other optional services) are based on Policy and Filter. Policies (or called Classes as well) are specified items indicating different actions for a service. Policies are applied to different objects classified by the predefined filters. Basically, a object is classified by the combinations of When, Source, Destination and TCP/UDP/ICMP Service. A filter contains the settings of those items When, Source, Destination and Service, and also an associated Policy. Traffic that matches the filter will be applied to the specified policy.
The common operation buttons
FortiWAN manages most of its rules/filters/policies with top-down evaluation method where the rules are prioritized in descending order.
Click this button, to add a new rule below the current rule.
Click this button, to delete the rule.
Click this button, to move the rule up a row.
Click this button, to move the rule down a row.
Write a note for this rule.
The function is disabled.
The function is enabled.
This symbol indicates a default policy, rule or filter, which is unmodifiable and indelible.
Configuration on When
This is for filtering traffic by different time period which is predefined in “Busyhour Settings”.
Configuration on Source and Destination
This is for filtering the established sessions from/to specified source/destination. The options are:
IPv4/IPv6 Address : Matches sessions coming from or going to a single IPv4/IPv6 address. e.g. 192.168.1.4.
IPv4/IPv6 Range : Matches sessions coming from or going to a continuous range of IP addresses.
e.g. 192.168.1.10-192.168.1.20.
| IPv4/IPv6 Subnet | : | Matches sessions coming from or going to a subnet. e.g.192.168.1.0/255.255.255.0. |
| WAN | : | Matches sessions coming from or going to WAN. |
| LAN | : | Matches sessions coming from or going to LAN. |
| DMZ | : | Matches sessions coming from or going to DMZ. |
| Localhost | : | Matches sessions coming from or going to FortiWAN. |
| Any Address | : | Matches all sessions regardless of its source or destination. |
| FQDN | : | Matches sessions coming from or going to FQDN. |
| IP Grouping Name | : | Matches sessions coming from or going to the IP addresses that predefined in IP groups (See “IP Grouping”). |
Configuration on Input Port
This is for filtering the traffic coming from specified physical ports. Input Port are the item used to evaluate outbound traffic for only Auto Routing (See “Auto Routing”) so far. Ports (normal ports, VLAN ports, redundant LAN\DMZ ports and aggregated LAN\DMZ ports) defined in [Network Setting > VLAN and Port Mapping] (See “Configurations for VLAN and Port Mapping”) are listed for options:
| Port X | : | Matches sessions coming from the specified normal port. |
| Port X.[VLAN Tag] | : | Matches sessions coming from the specified VLAN port. |
| LAN Bridge: [Lable] | : | Matches sessions coming from the specified redundant LAN port. |
| DMZ Bridge: [Lable] | : | Matches sessions coming from the specified redundant DMZ port. |
| LAN Bonding: [Lable] | : | Matches sessions coming from the specified aggregated LAN port. |
| DMZ Bonding: [Lable] | : | Matches sessions coming from the specified aggregated DMZ port. |
Configuration on Service
This is for filtering the established sessions running specified service. It contains some well-known services for options and user-defined services (TCP@, UDP@ and Protocol#):
- FTP (21) l SSH (22) l TELNET (23) l SMTP (25) l DNS (53) l GOPHER (70) l FINGER (79)
- HTTP (80) l POP3 (110) l NNTP (119) l NTP (123) l IMAP (143) l SNMP (161) l BGP (179) l WAIS (210) l LDAP (389) l HTTPS (443) l IKE (500) l RLOGIN (513) l SYSLOG (514) l RIP (520) l UUCP (540) l H323 (1720) l RADIUS (1812) l RADIUS-ACCT (1813) l pcAnywhere-D (5631) l pcAnywhere-S (5632) l X-Windows (6000-6063)
- GRE l ESP l AH l ICMP l TCP@ l UDP@
- Protocol# l Any