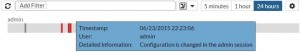
Visualization support for the Admin Logins page
A useful chart is now generated for Admin login events under FortiView > Admin Logins. You can view the information in either Table View or Timeline View (shown below). In Timeline View, each line represents on administrator, with individual sessions indicated per administrator line. When you hover over a particular timeline, detailed information appears in a tool tip.